The IESRE/IPST Sky Photography Project

 | The IESRE/IPST Sky Photography Project |  |
This project is supported by the Institute for Earth Science Research and Education, Worcester, Pennsylvania, USA, and the Institute for the Promotion of Teaching of Science and Technology, Bangkok, Thailand.
Whenever we want to find out about the weather, the first thing we do, even when we are indoors, is look at the sky. Is it blue and clear? Does it look "dirty" from air pollution? Is it gray and overcast? Are there cumulus or cumulonimbus clouds? Are clouds moving fast across the sky or hardly at all? It is clear from our experiences with sky-watching that the sky tells us a lot about the weather and our local environment. Is it possible to learn more by making quantitative measurements that complement our qualitative obserations? If we can do that, then we can turn the simple observations we use to plan our outdoor activities into real atmospheric science.
Sky photography with a digital camera allows us to build a permanent record of the state of the atmosphere. Any photograph of the sky provides useful information about the atmosphere when the photo was taken. But, if we photograph the sky over long periods of time, following an established protocol, these photographs can also provide quantitative information about the changing state of the atmosphere.
If you already have a digital camera, participating in this project will not cost anything! Here is all you need:
It takes only a few minutes to step outside and photograph the sky. It may take a little longer if the scene you choose to photograph is not close to your home or school. This activity should be done only on days when you can see most of the sky above the horizon at the location you have chosen—it is OK for a few clouds to be present. Analyzing a photograph with ImageJ software (generating a density plot along a line drawn up from the horizon) and saving the results of that analysis will take no more than 10-15 minutes. Additional study of your results, such as using a spreadsheet to compare all data collected during a month, can take more time.
This project is suitable for any students mature enough to use a digital camera correctly—older elementary and young middle school students will certainly have no difficulty. The software is easy to use for this application, and the required processing can be done by any student with basic computer skills—using a mouse, naming and saving files, etc.
Sky photography is an excellent way to become more aware of what is happening in Earth's atmosphere, and how it reflects weather, climate, and the quality of your local environment. Especially if you are already collecting basic weather data, this project provides a visual record that supplements the measurements you are already making. If you are collecting pyranometer data (at one-minute intervals), sky photographs will help to explain the fluctuations in insolation you will usually see in those data. Like many projects that involve observations and recording data, this project will teach you how to organize and conduct an experiment in a way that makes it as simple as possible for others to understand and interpret what you have done. You will learn a lot about digital photography, too, especially if you are using a camera with manual settings.
This project serves as an introduction to the scientific applications of digital photography. It is also a great way to collaborate with students in other parts of your country and in other countries. Because the experiment protocol is very simple and requires only a digital camera and some free software, there are no cost constraints that will prevent schools around the world from participating.
| School Name | Address | Contact Information (name, email) | Longitude (decimal degrees) | Latitude (decimal degrees) | Elevation (meters) |
|---|---|---|---|---|---|
| Camera Brand | Camera Model | Camera Settings |
|---|---|---|
| Automatic ◊ ISO ("film speed") = f-stop = exposure = focus = |
| Photo taken from... | Facing... (compass direction) | Comments and important scene features |
|---|---|---|
| Date | Time (UT) | File Name | Weather Conditions | Additional Comments |
|---|---|---|---|---|
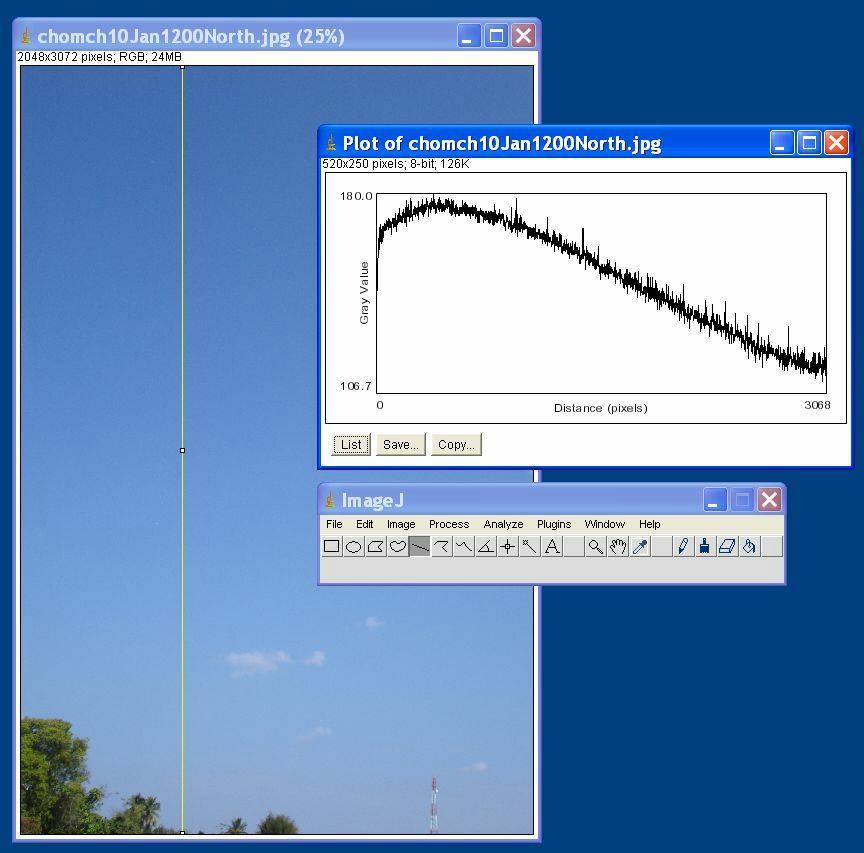
Below is an example of a sky photograph. It was submitted by Srisaang Panyangam from Chumchon Banmaekhaowtomluang School in Chiang Rai—the first photograph submitted following a workshop at IPST, Bangkok, in early January, 2009. This photograph was taken using automatic camera settings. The "line" box is checked on the ImageJ toolbar and the cursor has been used to draw a straight line from the bottom of the photo to the top. The graph shows the result from choosing ImageJ's "Plot Profile" from the "Analyze" option on the toolbar. ImageJ converts the photograph to "grayscale," with brightness levels from 0 (black) to 255 (white) and plots the values as a function of distance above the horizon, represented as pixels. The data represented in this graph can be saved as a comma-delimited (.csv) file than can be opened directly in Excel, or "imported" into an existing worksheet.
This analysis represents quantitatively what is qualitatively obvious from looking at the photo. The sky is mostly clear, but there is a layer of haze close to the ground that causes the sky to be a little darker near the horizon. The decrease in brightness, and the location of the maximum brightness above the horizon, is related to aerosols—particulates suspended in the atmosphere. The shape of the graph provides a quantitative representation of what is observable as haziness and decreased horizontal visibility through the atmosphere. Often, the haze evident in this photo is caused by urban pollution from vehicles, for example. Windblown dust can also decrease atmospheric visibility. The ability to quantify the information contained in these photographs is what converts "just" an image into real atmospheric science.

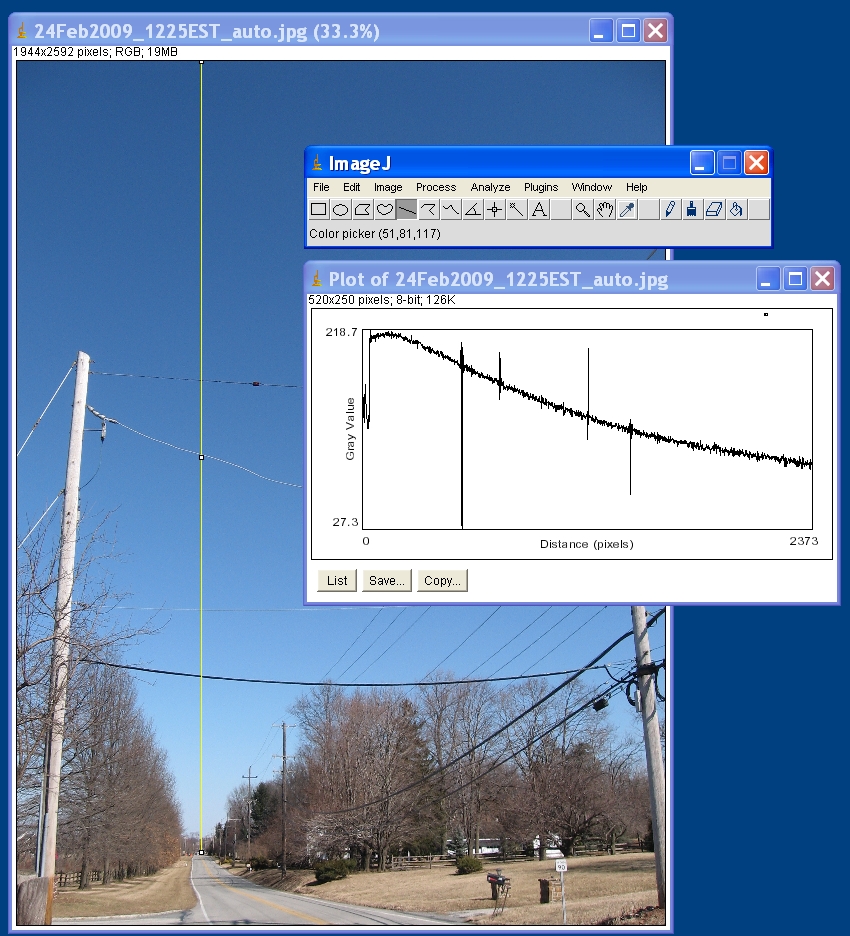
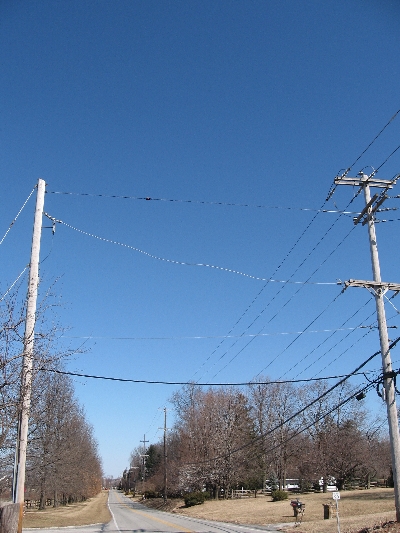
The next photo shows a scene taken a little after local clock noon, facing toward the northeast along a road near my home. I chose this scene because it gives the best view down to the horizon that is available near my home. Although the power lines running across the road might at first might seem just to get in the way, they actually serve as convenient markers that help to relate the density plot to a particular location in the sky above the road. This photo, too, is taken with automatic camera settings. The sky doesn't appear much different in this photo from the sky over the scene from Thailand. But, the shape of the density curve, with its maximum a little closer to the horizon, might indicate that the air over this scene is a little cleaner than the air over the Thailand scene. Indeed, this scene, looking toward the northeast, is facing away from the large metropolitan area around Philadelphia. However, note that it is not easy to compare these two photos and their density plots directly (especially the absolute values of the densities), because they were taken with different cameras. Comparisons are further complicated because the time of day and direction of the photo from Thailand is not known.

Imagine looking at a distant tree-covered mountain ridge. On a very clear day, the ridge will be distinct and green. On a hazy day, when visibility is poor, the ridge will be grayish or bluish, and less detail will be visible. The same kinds of changes will be visible in the face of a distant large building. On very hazy days, it may even be the case that a building or other distance scene will not be visible at all through the atmosphere. With ImageJ software, it is possible to quantify changes in the appearance of a distant object by comparing characteristics of a small portion of that image either against the same portion from a different day, or against the sky background just above the object.
The basic requirement for interpreting horizontal visibility is that the lighting conditions on the scene being viewed must always be as nearly the same as possible. If the object you are photographing is sometimes sunlight and sometimes shadowed, then, of course, the brightness of that object will be much different under those two conditions. It is probably best to photograph a distant object when it is sunlit, and not in shadow.
If you are facing north in the northern hemisphere, outside the tropics (north of the Tropic of Cancer), the sun is always at your back at noon. So, an object to the north will always be sunlit at noon. If you are close to the Tropic of Cancer, the summer noontime sun will be very close to directly overhead. The reverse conditions apply if you are in the southern hemisphere, south of the Tropic of Capricorn. If you are inside the tropics, sunlighting conditions on a distant object become more complicated. In that case, it may be better to choose an object to the east or west and photograph it consistently in the afternoon (if it is to the east) and in the morning (if it is to the west), to ensure that it is always sunlit. But, in any case, sunlighting conditions on a distant object will always vary with the seasons. As a result, you may need to photograph the same object during several seasons in order to separate seasonal effects from changes in horizontal visibility through the atmosphere.
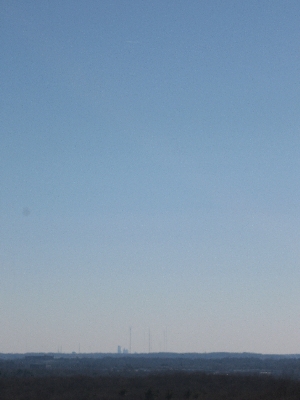
The first photo below is the skyline over the city of Philadelphia, PA, USA, taken at about 12:30EST on 24 February 2009.
The next two photos show histograms of grayscale pixel counts (one of the choices under ImageJ's "Analyze" tool) generated first by zooming in on one of
the tall buildings on the skyline and then on the sky just above the building. The histograms show the mean grayscale value of all pixels in each scene.
The ratio of the mean pixel
value for the building to the mean pixel value for the sky is a measure of the horizontal visibility. This building is about 29 km southeast of where the photo was taken.
Similar histograms could
be generated by using an area just below the building. In the summer, when skies usually hold more water vapor and when there is more air
pollution over Philadelphia, it is not uncommon for these tall buildings on the Philadelphia skyline to be invisible—that is,
(mean pixel value for building)/(mean pixel value for sky) = 1.
 | |
 |  |
 |  |
 |  |